In the world of web development, ensuring your website or web app functions flawlessly across all browsers and devices is paramount. This includes the widely used Mobile Safari on iOS devices like iPhones and iPads. Debugging on mobile devices, however, presents unique challenges compared to desktop environments.
Fortunately, Apple’s Web Inspector tool offers a powerful way to debug Mobile Safari directly from your Mac. This article will guide you through understanding Web Inspector, why it’s essential for debugging Mobile Safari, and how to use it effectively.
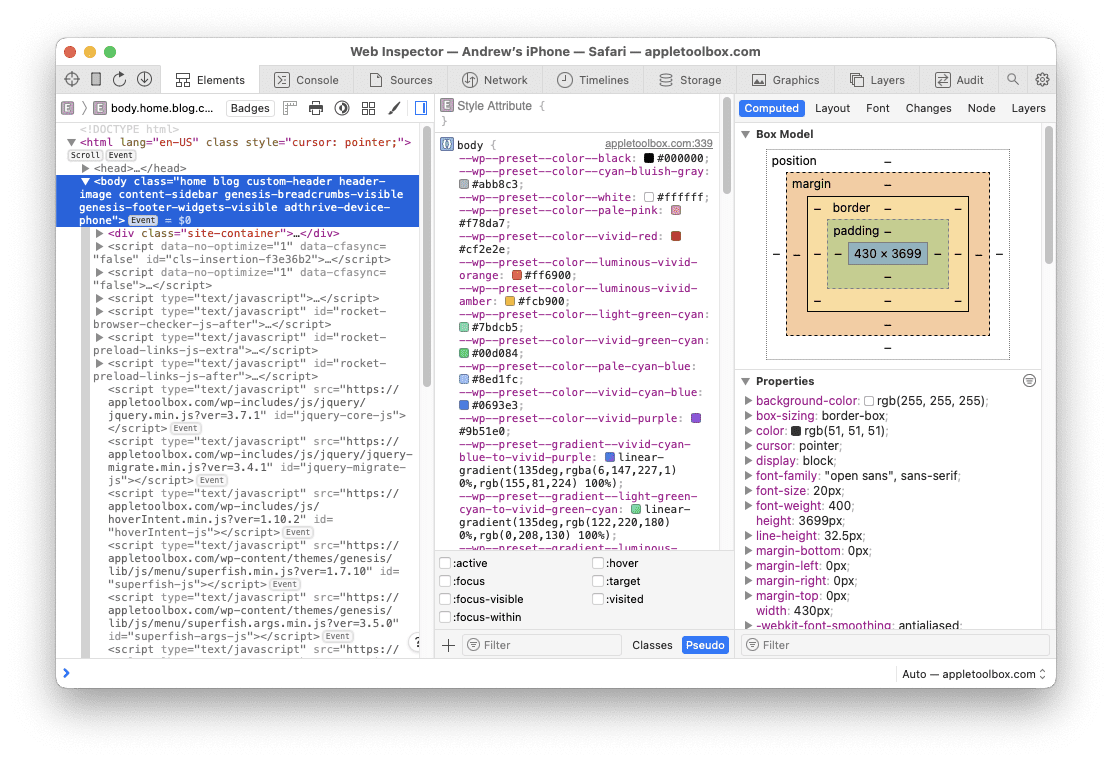
Web Inspector is a diagnostic tool integrated into Safari that helps developers debug web content on macOS and iOS devices. It provides a wide range of functionalities, including inspecting the HTML and CSS of a webpage, debugging JavaScript, analyzing network traffic, and assessing performance.
DOM and CSS Exploration: Allows you to inspect the HTML structure of a page and live-edit CSS styles to see changes in real-time.
JavaScript Debugging: Helps set breakpoints, step through code, and investigate issues in your JavaScript logic.
Network Monitoring: Shows network requests, timings, and allows you to analyze how browser resources are loaded.
Performance Profiling: Provides tools to identify performance bottlenecks in your web page.
Web Inspector’s capabilities make it an indispensable tool for web developers aiming to optimize their websites or web applications for the Safari browser.
Why Would You Need to Debug Mobile Safari?
Debugging Mobile Safari is crucial for several reasons:
Device-Specific Issues: Websites and web apps may exhibit behavior on mobile devices that you don’t encounter on desktop browsers, including layout issues, touch interactions, and performance problems.
iOS User Base: With a significant portion of the global mobile market using iOS devices, ensuring optimal performance on Mobile Safari directly impacts user experience and satisfaction.
Feature Parity: Mobile Safari supports different features and APIs compared to its desktop counterpart and other mobile browsers. Debugging helps ensure your web content leverages these capabilities effectively while maintaining compatibility.
JavaScript Compatibility: Mobile Safari may have slightly different JavaScript behavior compared to its desktop counterpart. Web Inspector can identify discrepancies.
Before Getting Started
There are a few things to be aware of before you can get started with wanting to use Web Inspector to debug mobile Safari. The first of which is that both your iPhone or iPad and your Mac must all be using the same Apple ID. Additionally, you must be using iCloud Sync for Safari on the devices that you want to use to debug.
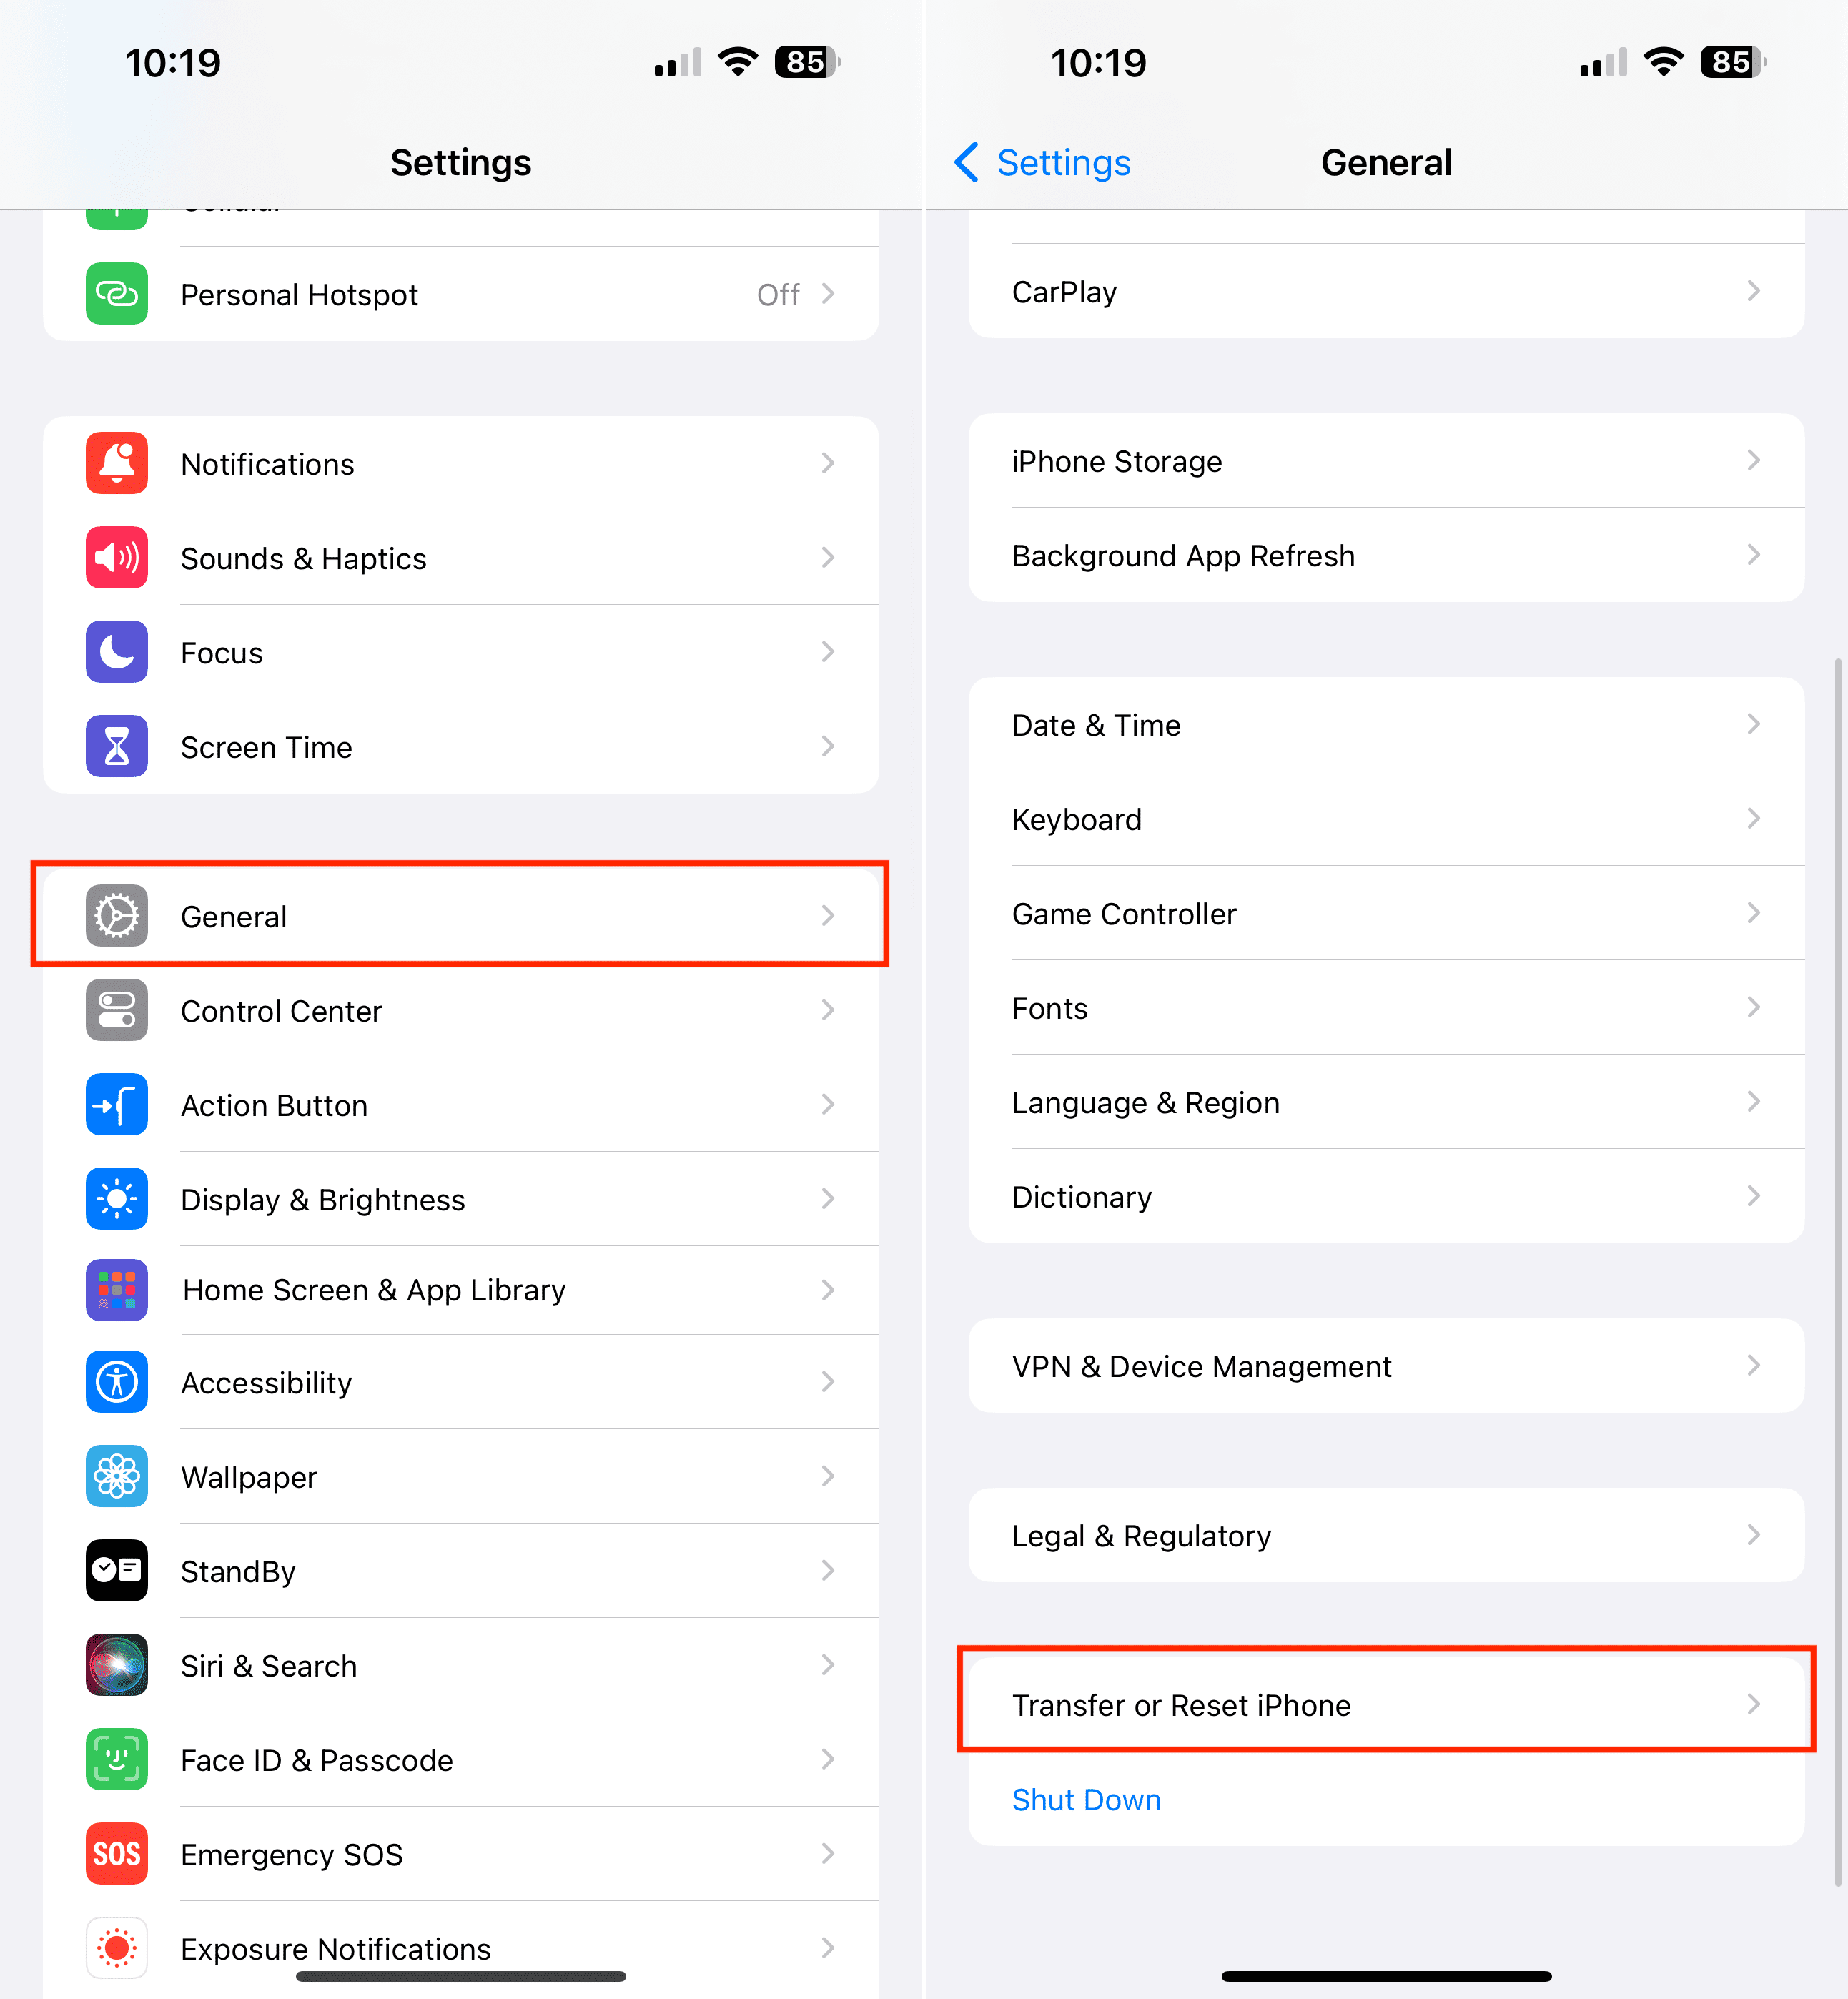
From there, you’ll want to reset your Location and Privacy settings on your iPhone or iPad. This has been found to ensure that you don’t run into any problems during the debugging process. Here’s how you can do so:
Open the Settings app on your iPhone or iPad.
Tap General.
Swipe all the way to the bottom.
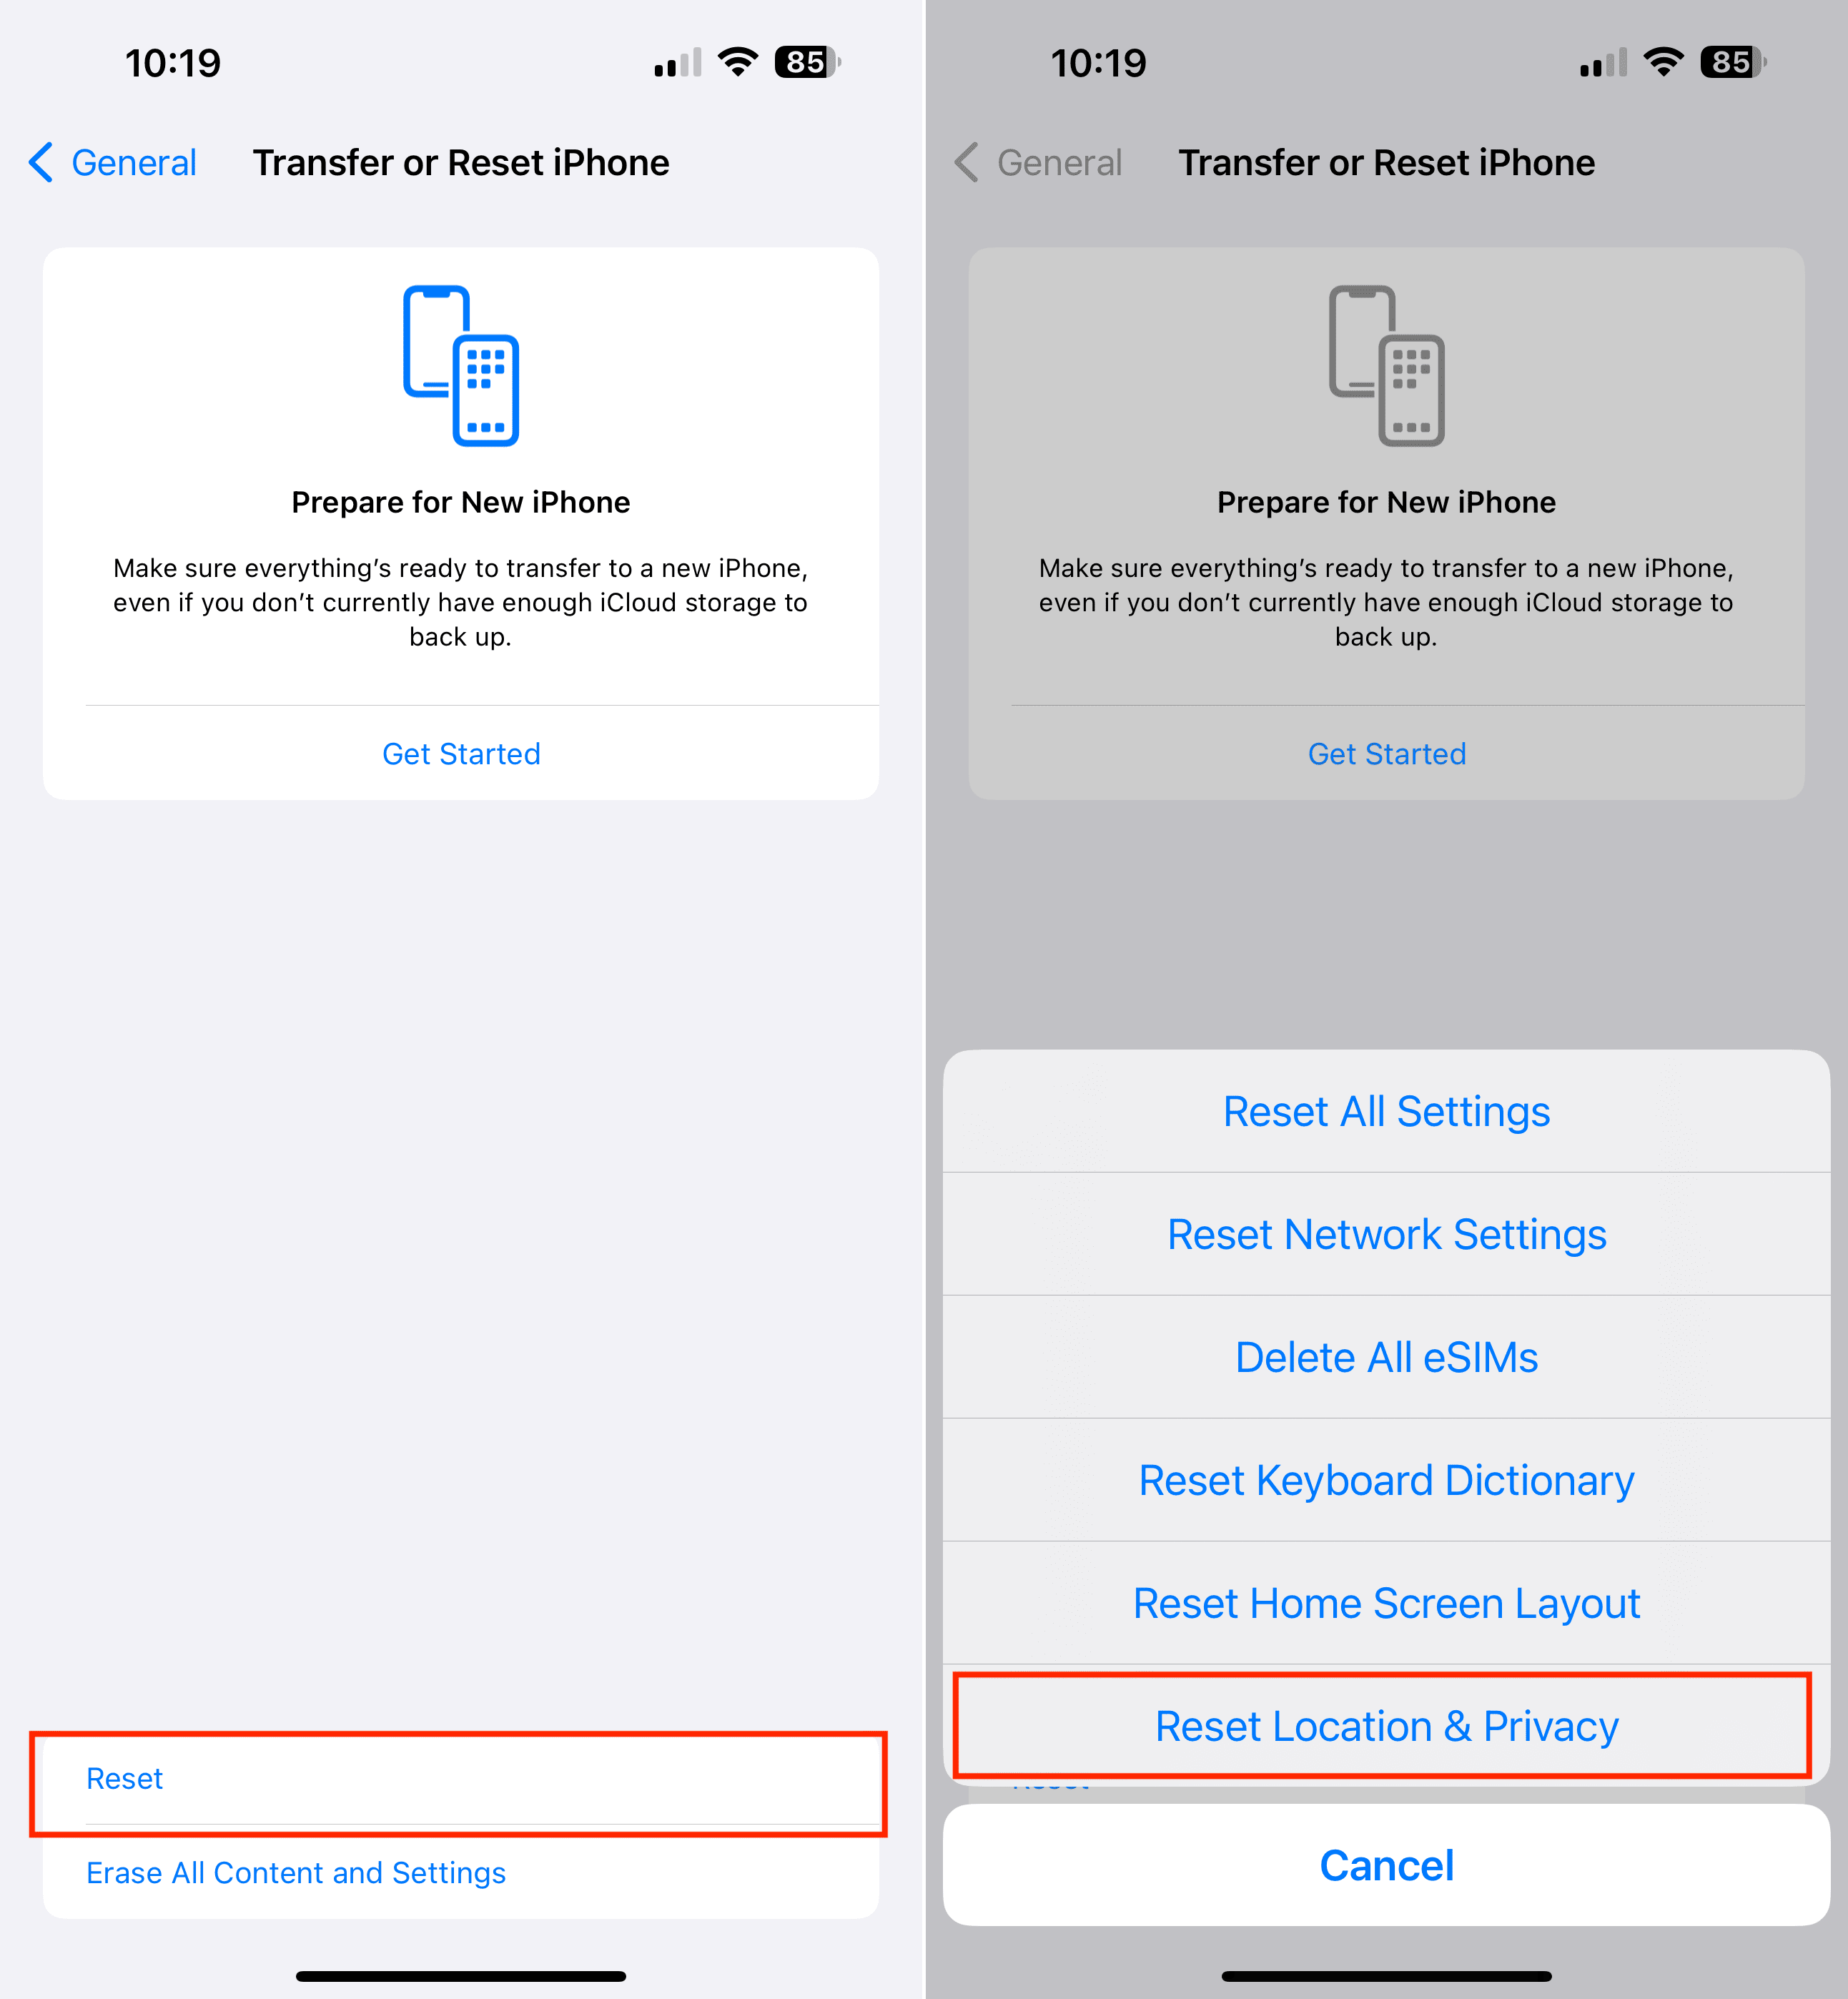
Tap Transfer or Reset iPhone (iPad).
At the bottom of the next page, tap Reset.
From the pop-up menu that appears, tap Reset Location & Privacy.
When prompted, enter your iPhone (or iPad) passcode.
How to Use Web Inspector to Debug Mobile Safari
To start debugging Mobile Safari using Web Inspector, you’ll need to configure both your iOS device and Mac. Here’s how:
Preparing Your Devices
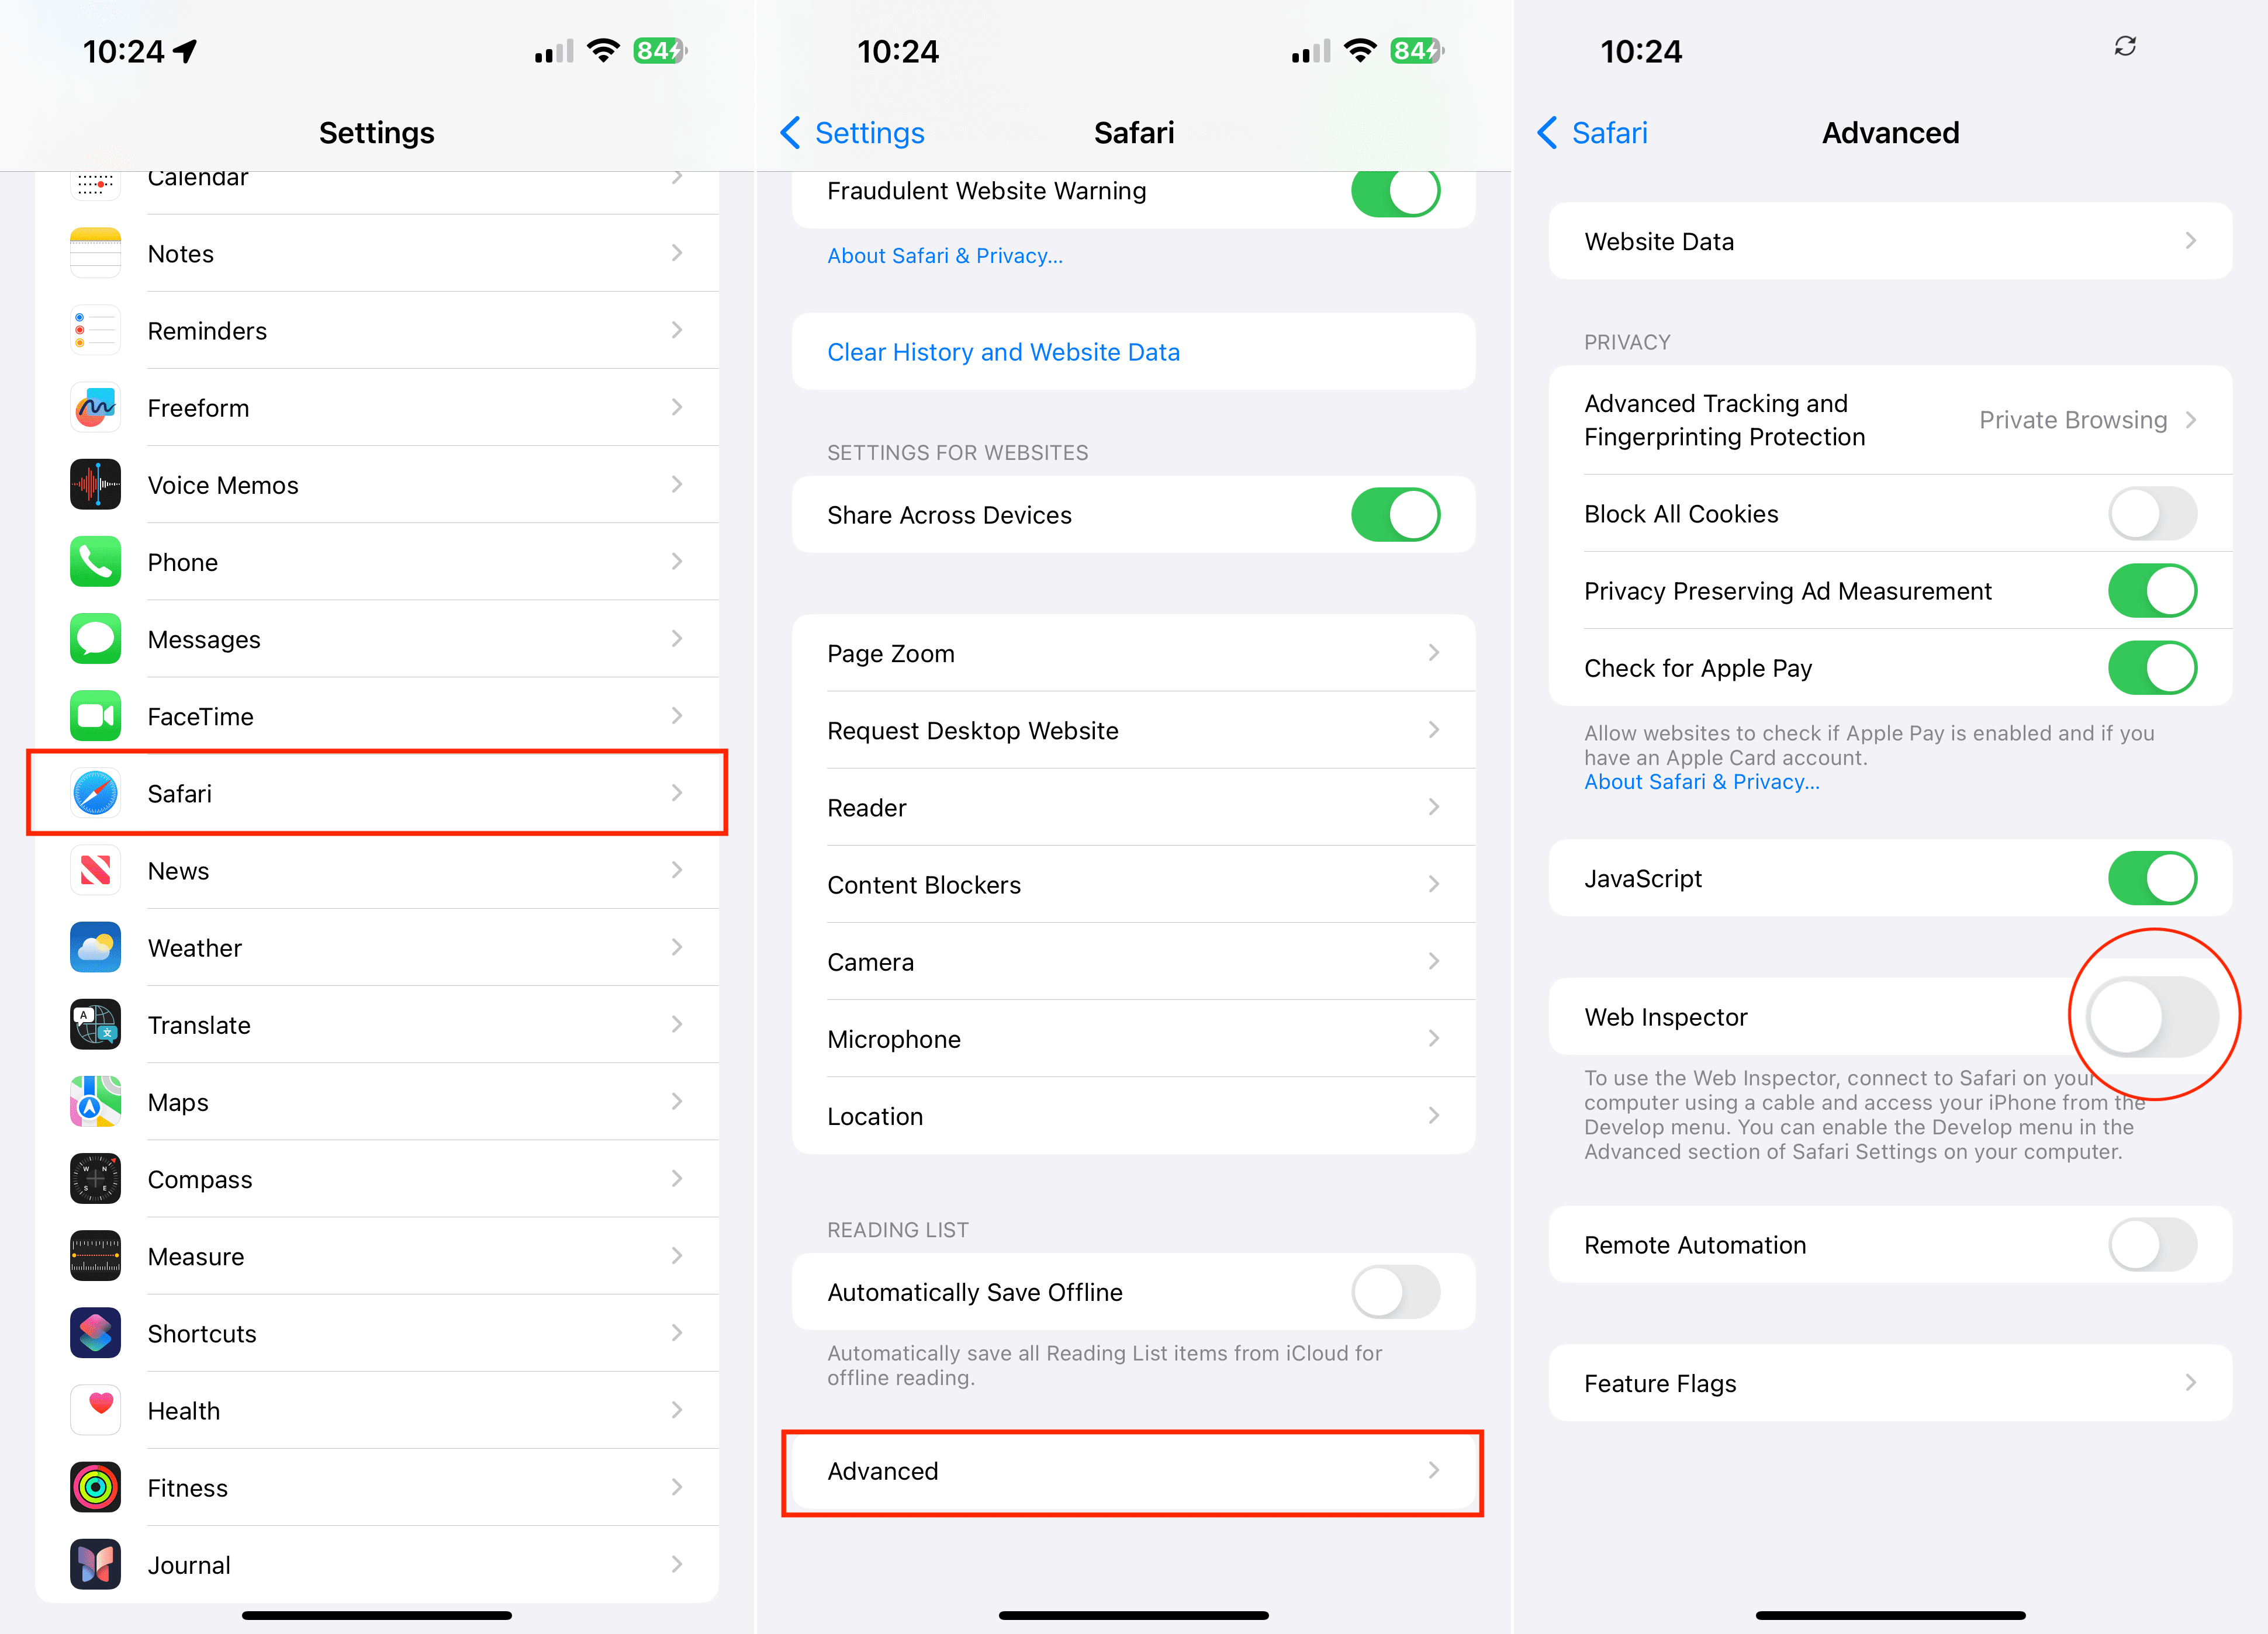
Enable Web Inspector on iOS:
Open the Settings app on your iPhone or iPad.
Scroll down and tap Safari.
Scroll to the bottom of the page and tap Advanced.
Tap the toggle next to Web Inspector to the On position.
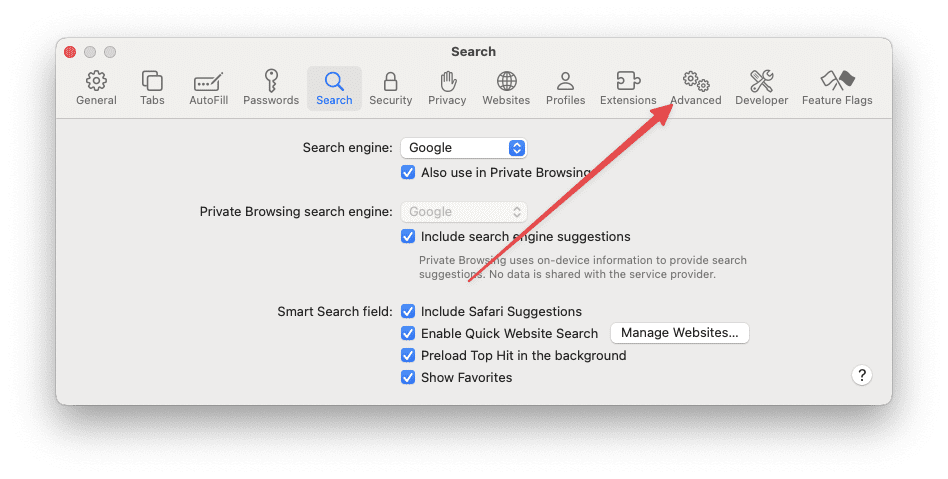
Enable Safari Developer Mode on Mac:
Open Safari on your Mac.
Click Safari in the top left corner of your Menu Bar.
From the drop-down menu, highlight and select Settings.
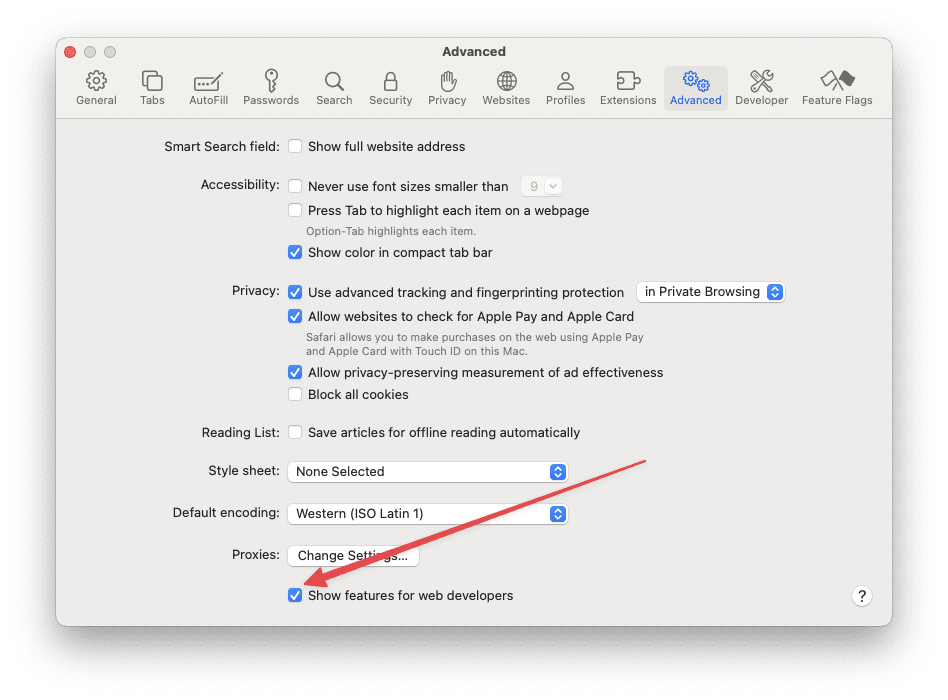
Click the Advanced button in the Safari Settings window.
Click the checkbox next to Show features for web developers.
Connecting and Debugging
Connect Your iOS Device to Your Mac: Use a USB cable to connect your iPhone or iPad to your Mac. Trust the computer if prompted on your iOS device.
Open Your Web Content in Mobile Safari: On your iOS device, navigate to the website or web app you wish to debug.
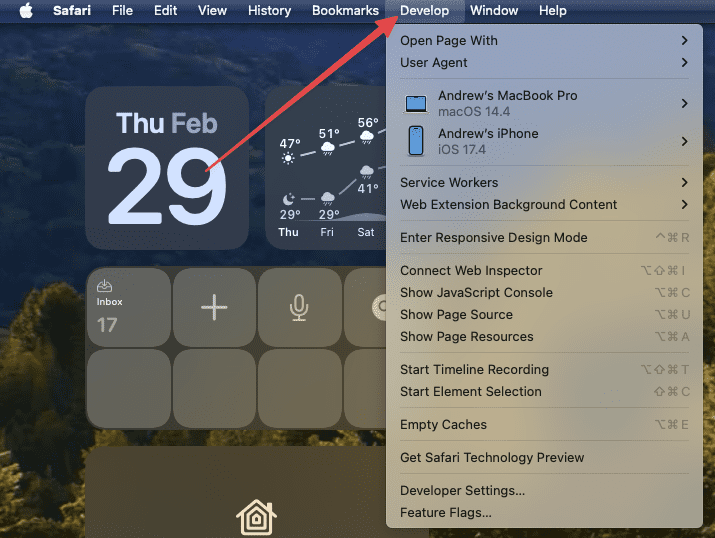
Access Web Inspector:
On your Mac, open Safari.
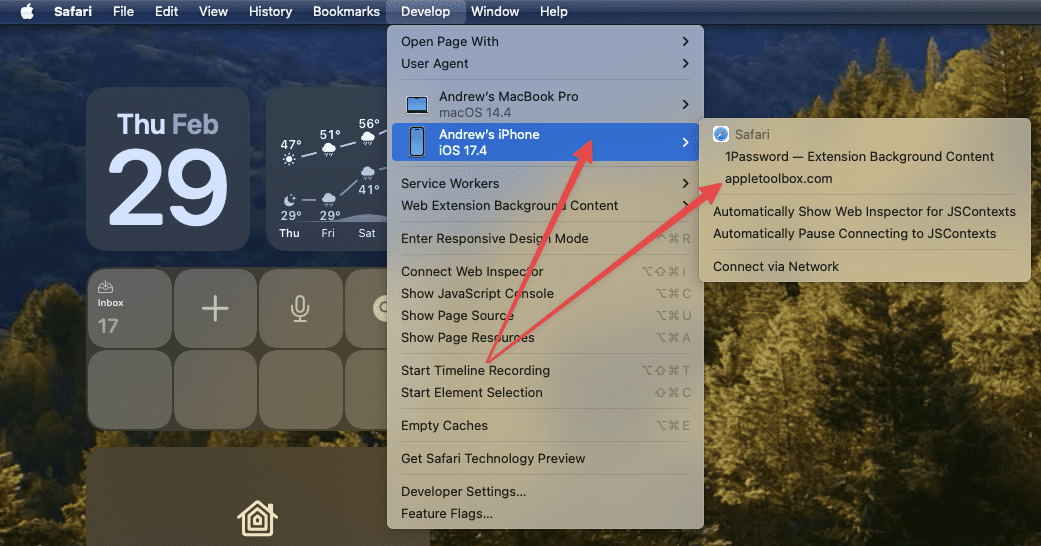
From the Safari menu bar, select “Develop”
Highlight and select [Your iOS device’s name] > [The name of the open web page on your device].
This opens the Web Inspector interface corresponding to the web content currently displayed on your iOS device.
Debug Your Web Content: Utilize Web Inspector’s tools to inspect elements, debug JavaScript, and analyze network requests. Any changes or debugging actions you perform in Web Inspector reflect in real-time on your iOS device, allowing for an interactive debugging experience.
Using Safari’s Web Inspector Tools You now have access to the familiar suite of Web Inspector tools. Here’s how to employ them:
Elements Tab: Inspect and modify HTML and CSS.
Console Tab: View JavaScript errors and logs, and interact with the page’s code.
Network Tab: Analyze network requests and their performance.
Sources Tab: Debug JavaScript, set breakpoints, and pause code execution.
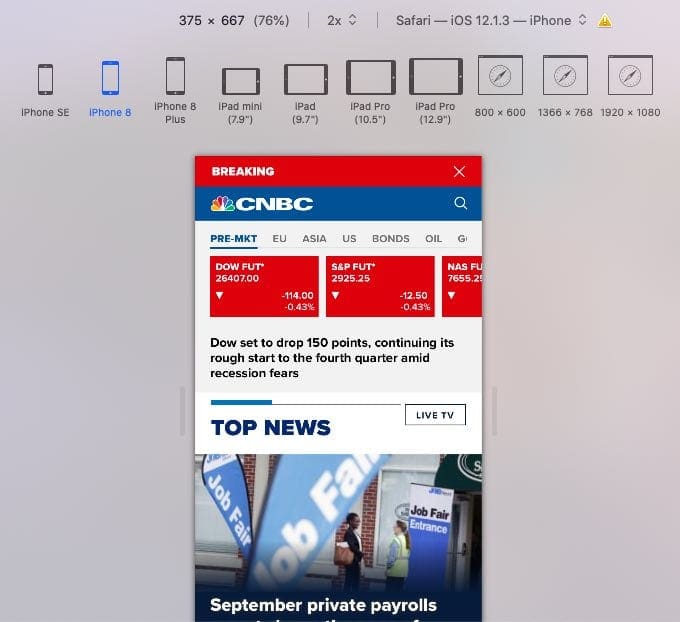
Another helpful tip for Web Devs who are trying to debug mobile safari, there’s a nice little shortcut. When pressing CTRL + CMD + R in Safari, you can get a preview of what a website would look like on different devices.
Toggle the keyboard shortcut to exit out of web dev view.
iPhone or iPad Now Showing up in the Safari Develop Menu?
When you’re trying to use the Safari Develop menu to debug or test web content on your iPhone or iPad, but your devices aren’t showing up, it can be a frustrating experience. Fortunately, there are several steps you can take to troubleshoot and resolve this issue.
Update to the Latest Software Versions: Make sure that both your Mac and your iOS devices are running the latest versions of their respective operating systems. Compatibility issues can arise from outdated software.
Double-check Your Cable: Connect your iPhone or iPad to your Mac using a USB cable. Wireless connections might not always be reliable for debugging purposes. It’s important that you either use the cable that came in the box, another Apple-branded cable, or one that is MFi Certified.
Trust Your Computer: When you connect your device to your Mac, you might see a prompt asking whether you trust this computer. Select “Trust,” and enter your device passcode if required.
Connect Hardware Devices: Within Safari’s Preferences, under the Advanced tab, ensure there is no setting blocking the connection to hardware devices.
Restart Your Devices: Simple as it may seem, restarting both your iOS device and your Mac can resolve many connectivity issues.
Restart Safari: Close and reopen Safari on your Mac. Sometimes, the Develop menu needs a refresh to recognize connected devices.
Same Network: If you are attempting to use a wireless debugging feature available in some iOS and macOS versions, ensure both your Mac and iOS devices are connected to the same Wi-Fi network.
Firewall and Security Software: Check your Mac’s firewall settings and any installed security software that may block the connection between your devices.
Check for Conflicting Software: Other software running on your Mac, like virtual machines or network utilities, might interfere with the connection. Consider closing such software to test if it resolves the issue.
Conclusion
Debugging Mobile Safari is a critical task for developers aiming to provide a seamless web experience to iOS users. With the Web Inspector tool, developers have a powerful suite of debugging functionalities at their disposal, enabling them to identify and resolve issues specific to mobile environments.
By following the steps outlined in this guide, you can leverage Web Inspector to ensure your websites and web applications perform optimally on Mobile Safari, thereby enhancing the overall user experience for your iOS audience. Remember, a well-debugged site is the cornerstone of a successful web presence in today’s mobile-centric world.
Andrew Myrick is a freelance writer based on the East Coast of the US. He enjoys everything to do with technology, including tablets, smartphones, and everything in between. Perhaps his favorite past-time is having a never-ending supply of different keyboards and gaming handhelds that end up collecting more dust than the consoles that are being emulated.
This didn’t work for me with a Lightning to USB-A running into through USB-C Hub. After plugging in a direct Lightning connector to USB-C cable, the phone appeared in the “develop” dropdown.
I can confirm that this also fixed the issue for me. As soon as I reset the settings, my iPhone showed up in the Develop menu on my Mac. (iPhone 6S running 13.3.1, macOS Catalina 10.15.3)
just wondering if it’s possible to use this feature if you don’t have a live site? I want to make changes to a test site that has not launched yet and test on mobile. Thanks!
Thanks for writing this. Out of dozens – if not hundreds – of times I tried to do this though, I’ve got it working just a few. I’ve got different problems with it but at the moment, whatever website I try to inspect, I click on it (Developer -> device -> website) and nothing happens.
Web Inspector is used to debug websites and mobile hybrid apps, not the mobile device itself.
Web Inspector allows a developer to modify, debug, and optimize a website and then preview those changes on web pages. You can even see your content using various screen sizes, orientations, and resolutions.
To access these Safari developer tools, just enable the Develop menu in your Mac’s Safari’s Advanced preferences.
It would be nice if you could just connect an apple product to another apple product without having to scour the web for days or having to backup/upgrade/downgrade 2 operating systems and Safari apps to do so. This basically makes development and maintenance of iOS apps a painful & massive waste of time.
Well done biggest company in the world! Nice ‘ecosystem’ you have here, what a good reason to pay 10x over the odds for Apple hardware.
On this note, this article ends by saying:
“If your iDevice only briefly shows up in Safari’s Develop menu and then disappears.”
Then…. what, exactly? Please finish the sentence. Which versions of iOS / Safari are compatible enough to connect to one another?
And this is still a problem in 2019! I just need to debug scrolling behavior on an iPad but Apple is doing EVERYTHING to prevent me from completing this freaking simple task.
I am trying to see Web Inspector on my Mac but it shows my iPhone for a fraction of sec and iPhone is disappeared immediately, what can be the cause of it. Please can guide me.
It sounds like you aren’t running the same version of Safari on your Mac and iPhone–this often happens when a device only briefly shows up in Safari’s Develop Menu or flickers on/off. First update your iOS and your macOS (if applicable.)
If you’re running any betas, you probably need both your Mac and your device to run the Safari betas as well.
I WILL NOT DOWNLOAD SAFARI BEOWSER TO MY LAPTOP!!!!!!!!!!!!!!!!!! It’s being
red lined” by the Kasperasky Internet Security I have installed, and I feel confident that program knows what it’s talking about!!!!!!!!!!!!!!!!
Hi I was wondering since in the advance settings it says, “Web Inspector” I was curious if it can track other iOS device website data. If that iOS device allows you to. Thanks!
-Tom
What if I still see “No Inspectable Applications” message?
– Cache is cleared
– Private browsing is off
– Web Inspector enabled in Settings>Safari>Advanced


The easiest alternative is to download a browser inspector app like this one
https://apps.apple.com/ro/app/inspect-browser/id6450539608
This didn’t work for me with a Lightning to USB-A running into through USB-C Hub. After plugging in a direct Lightning connector to USB-C cable, the phone appeared in the “develop” dropdown.
I had a problem with inspecting an iPad. The key thing that solved it for me was this:
Reset your location and privacy settings on your device.
Settings > General > Reset > Reset Location & Privacy
Thanks! This worked for me.
I can confirm that this also fixed the issue for me. As soon as I reset the settings, my iPhone showed up in the Develop menu on my Mac. (iPhone 6S running 13.3.1, macOS Catalina 10.15.3)
This fixed it for me too, THANK YOU!!!
just wondering if it’s possible to use this feature if you don’t have a live site? I want to make changes to a test site that has not launched yet and test on mobile. Thanks!
Hi Lindsey,
It should work even if the site isn’t public. As long as you can access it on your Mac or iDevice, you can use the web inspector.
Sam
Thanks for writing this. Out of dozens – if not hundreds – of times I tried to do this though, I’ve got it working just a few. I’ve got different problems with it but at the moment, whatever website I try to inspect, I click on it (Developer -> device -> website) and nothing happens.
How do you know when mobile device has been debugged?
Hi Ginga,
Web Inspector is used to debug websites and mobile hybrid apps, not the mobile device itself.
Web Inspector allows a developer to modify, debug, and optimize a website and then preview those changes on web pages. You can even see your content using various screen sizes, orientations, and resolutions.
To access these Safari developer tools, just enable the Develop menu in your Mac’s Safari’s Advanced preferences.
Thx for this information man! 🙂
It would be nice if you could just connect an apple product to another apple product without having to scour the web for days or having to backup/upgrade/downgrade 2 operating systems and Safari apps to do so. This basically makes development and maintenance of iOS apps a painful & massive waste of time.
Well done biggest company in the world! Nice ‘ecosystem’ you have here, what a good reason to pay 10x over the odds for Apple hardware.
On this note, this article ends by saying:
“If your iDevice only briefly shows up in Safari’s Develop menu and then disappears.”
Then…. what, exactly? Please finish the sentence. Which versions of iOS / Safari are compatible enough to connect to one another?
And this is still a problem in 2019! I just need to debug scrolling behavior on an iPad but Apple is doing EVERYTHING to prevent me from completing this freaking simple task.
I am trying to see Web Inspector on my Mac but it shows my iPhone for a fraction of sec and iPhone is disappeared immediately, what can be the cause of it. Please can guide me.
Hi Manish,
It sounds like you aren’t running the same version of Safari on your Mac and iPhone–this often happens when a device only briefly shows up in Safari’s Develop Menu or flickers on/off. First update your iOS and your macOS (if applicable.)
If you’re running any betas, you probably need both your Mac and your device to run the Safari betas as well.
SK
Good web site, helped me with my Safari issue on my iPhone 6S. Thx.
Mobile inspector did the trick to get Safari back in business on my iPad! Thx
The safari in the iphone occure the problem that reload the webpage,when I try to debug the safari using mac.
Ralph says things he doesn’t quite know anything about.
I WILL NOT DOWNLOAD SAFARI BEOWSER TO MY LAPTOP!!!!!!!!!!!!!!!!!! It’s being
red lined” by the Kasperasky Internet Security I have installed, and I feel confident that program knows what it’s talking about!!!!!!!!!!!!!!!!
Safari 8 on ios8.3 … this does not work. In safari when i select develop > ipad … all i see is “use for development”
Useless!
Hi I was wondering since in the advance settings it says, “Web Inspector” I was curious if it can track other iOS device website data. If that iOS device allows you to. Thanks!
-Tom
What if I still see “No Inspectable Applications” message?
– Cache is cleared
– Private browsing is off
– Web Inspector enabled in Settings>Safari>Advanced